plot.scl
# S3 method for class 'scl'
plot(x, ..., hull_alpha = 1)
Arguments
See also
Other plot_fns:
plot_merges()
Examples
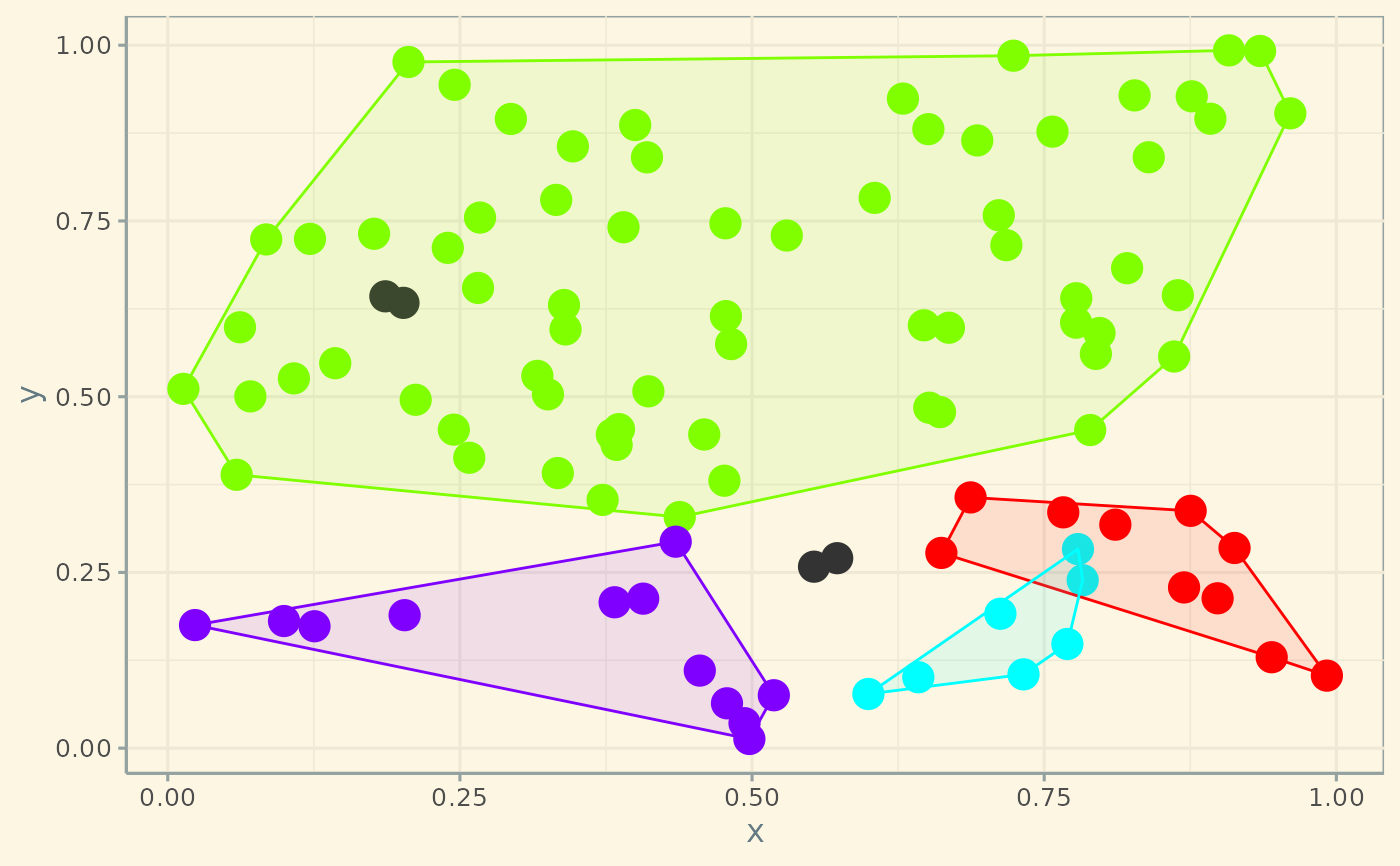
set.seed (1)
n <- 100
xy <- matrix (runif (2 * n), ncol = 2)
dmat <- matrix (runif (n^2), ncol = n)
scl <- scl_redcap (xy, dmat, ncl = 4)
plot (scl)
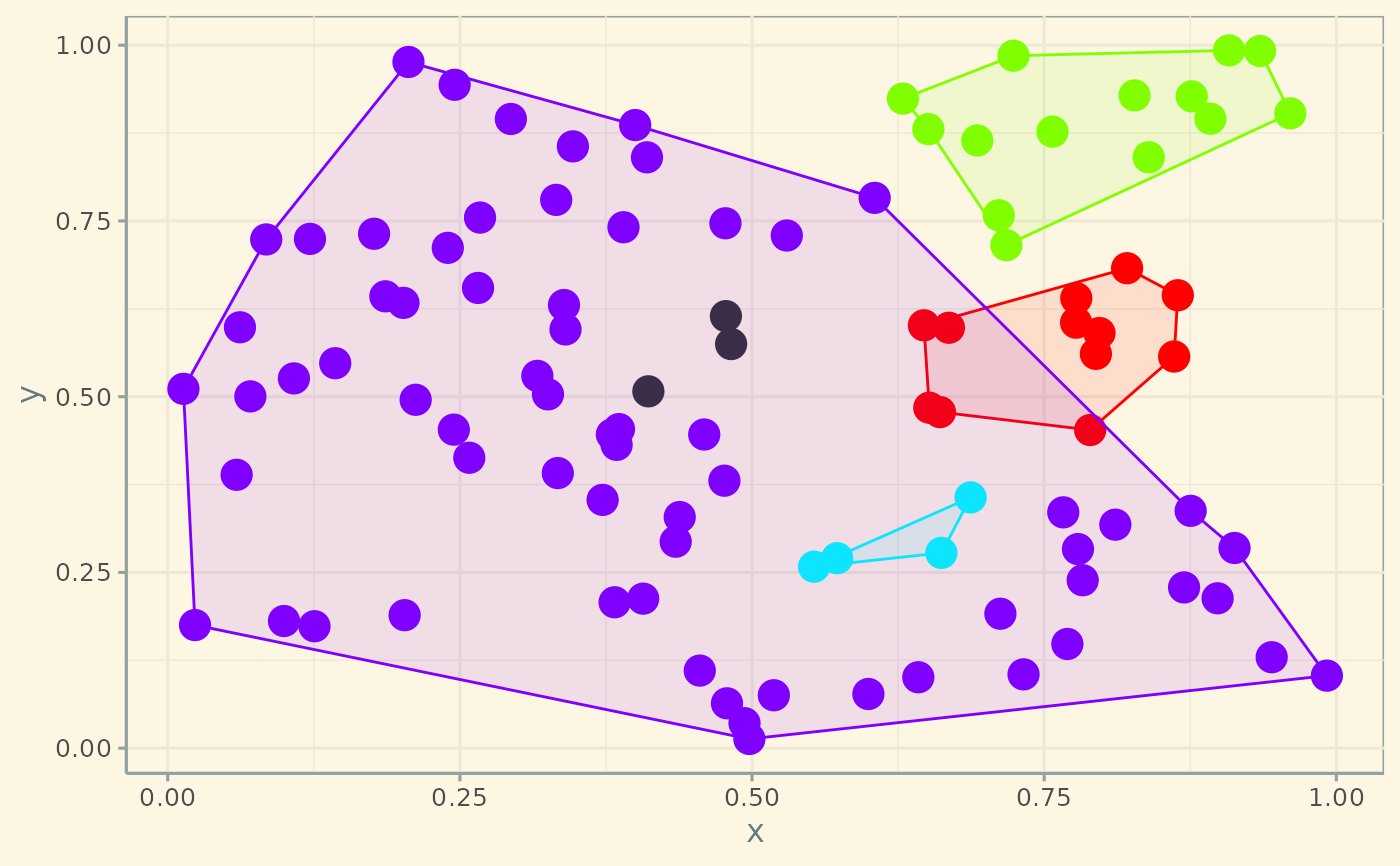 # Connect clusters according to highest (\code{shortest = FALSE}) values of
# \code{dmat}:
scl <- scl_redcap (xy, dmat, ncl = 4, shortest = FALSE, full_order = FALSE)
plot (scl)
# Connect clusters according to highest (\code{shortest = FALSE}) values of
# \code{dmat}:
scl <- scl_redcap (xy, dmat, ncl = 4, shortest = FALSE, full_order = FALSE)
plot (scl)